Even in the age of GPS and smartphones, learning to read a topographic (topo) map is an essential skill for any outdoor enthusiast.
A map won’t run out of batteries, lose a signal, or break if you drop it, making it the most reliable tool in your navigation kit.
A topographic map is a detailed, two-dimensional model of our three-dimensional world, showing the shape of the land itself, its hills, valleys, and slopes.
This guide will break down the process of reading one into simple, understandable steps, giving you the confidence to navigate the backcountry like a seasoned pro.
Table of Contents
Before you can interpret the terrain, you must first understand the foundational information provided in the map’s legend and margins. This data is the key to unlocking everything else on the map, translating its lines and colors into a clear picture of the landscape around you.
Map scale is a ratio that tells you how “zoomed in” your map is. A common scale is 1:24,000. This simply means one unit on the map (like one inch) equals 24,000 of the same unit on the ground. For a standard 1:24,000 USGS 7.5-minute quadrangle map, that translates to: 1 inch on the map = 2,000 feet on the ground. Most maps also include a graphical bar scale, which looks like a ruler and allows you to quickly visualize distances in miles or kilometers.
As an educator, I tell my students that the 1:24,000 scale is the gold standard for off-trail travel, as it shows immense detail. For long, established trails, a smaller scale map like 1:63,360 might be more convenient as it covers more area.
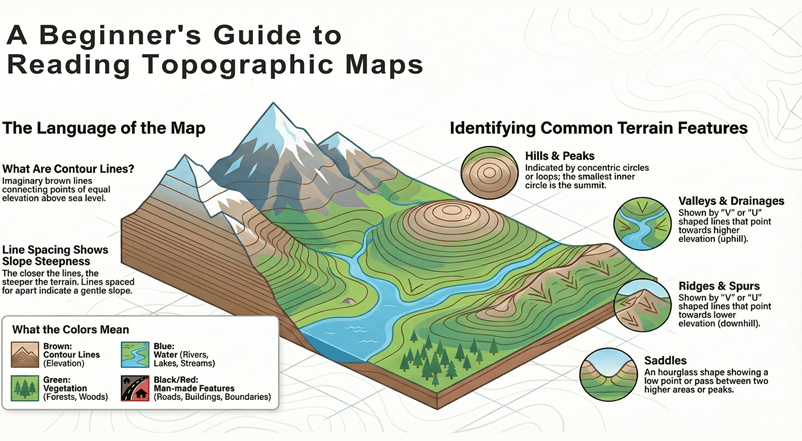
The map’s legend is your key to deciphering its visual language. Colors are used to represent major features of the landscape and human impact on it.
Contour lines representing elevation.
Water features (lakes, rivers, streams).
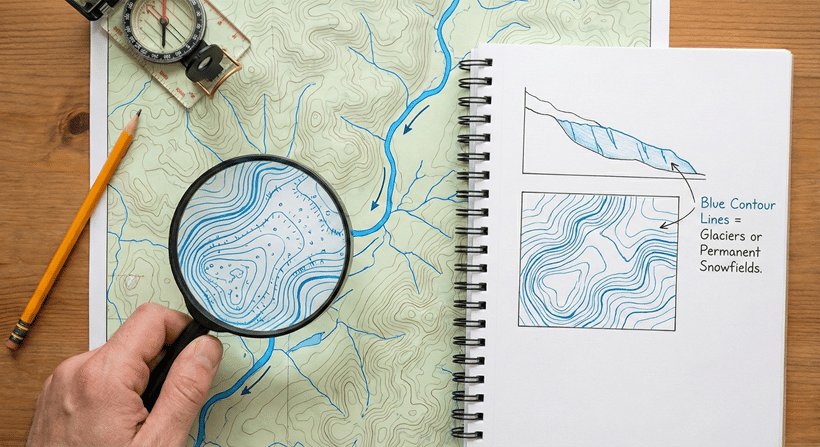
Glaciers or permanent snowfields.
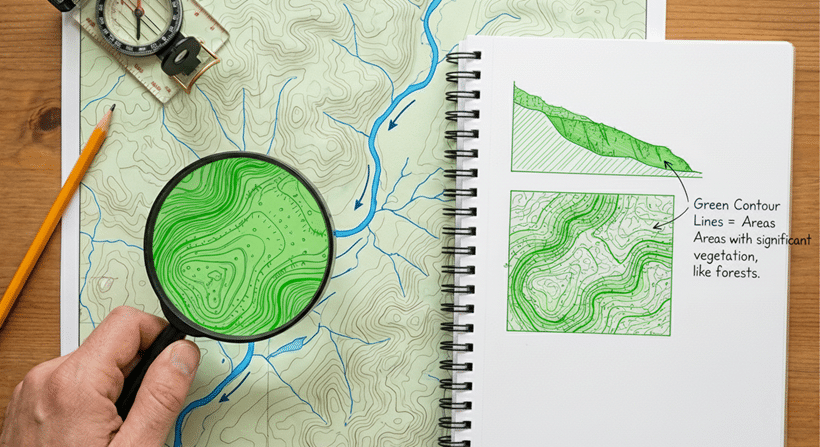
Areas with significant vegetation, like forests.
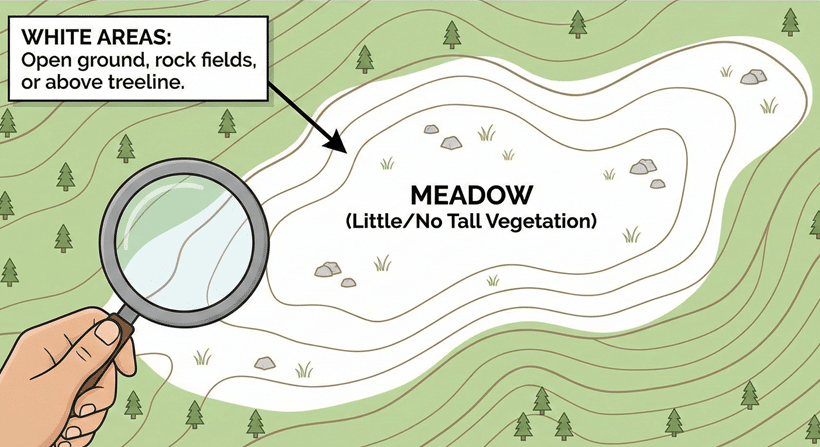
Areas with little or no tall vegetation, such as meadows, grasslands, rock fields, or areas above the treeline.
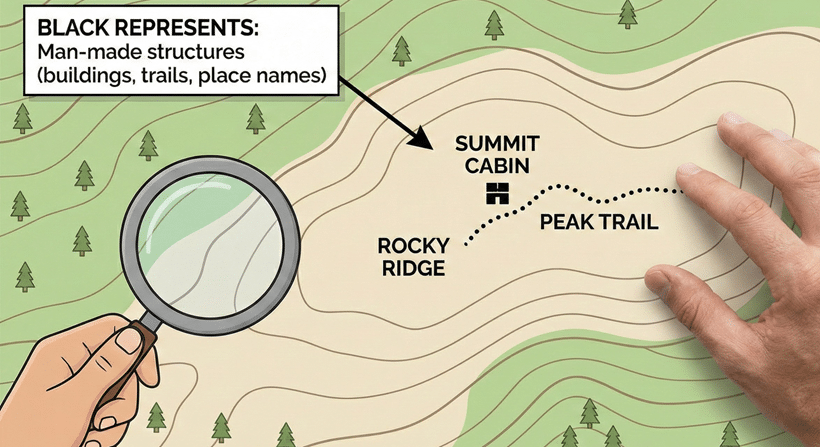
Man-made structures (buildings, trails, place names).
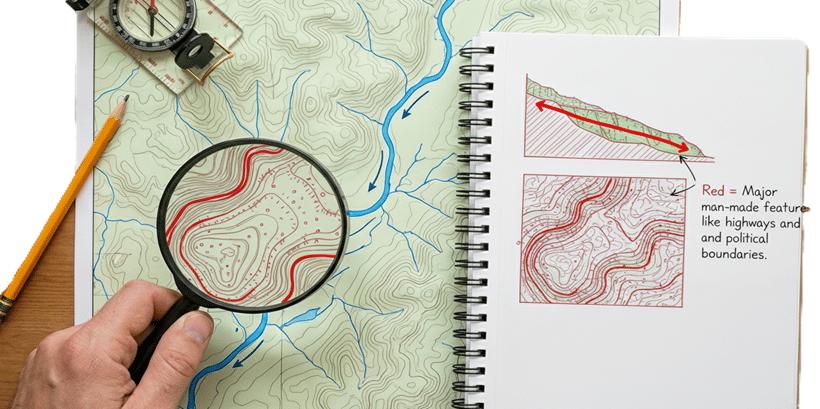
Major man-made features like highways and political boundaries.
Beyond colors, the legend contains a variety of symbols for specific features. These can include icons for mines, campgrounds, different types of roads (paved, gravel, 4WD), trails, and other points of interest that help you identify key landmarks. Be aware that purple may be used on older maps to indicate revisions made from aerial photographs that have not been field-checked.
In the map’s margin, you will find a diagram showing declination. This is the angle of difference between True North (the geographic North Pole, which is the top of your map) and Magnetic North (the direction a compass needle points). The angle changes based on where you are on Earth and gradually shifts over time. Accounting for declination is crucial for accurate navigation when using a map and compass together.
With this foundational knowledge, you’re ready to interpret the most important element of any topo map: the contour lines.
In a topographic map, contour lines are the primary feature that represent elevation. They are imaginary lines that connect points of equal elevation, allowing a flat, 2D map to show the shape, height, and steepness of the terrain. You can think of contour lines as representing “slices of land” at set elevation intervals. Imagine a mountain as a layer cake. The contour lines are the outlines of each layer when viewed from above.
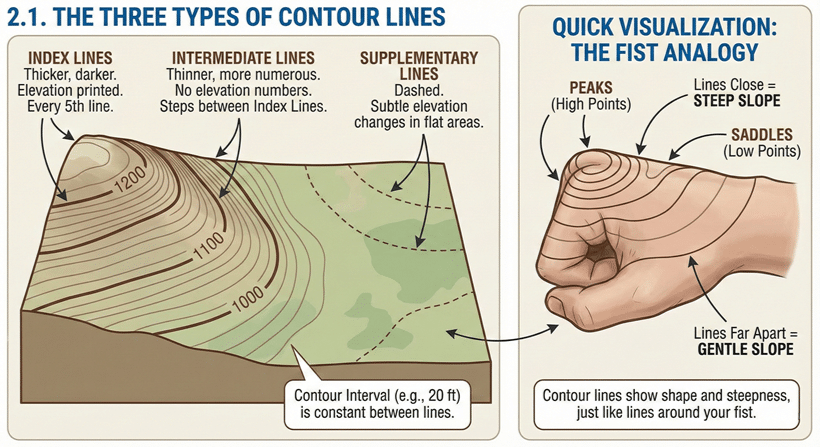
There are three main types of contour lines you’ll encounter on a map:
Quick Visualization: Make a fist. Notice the high points of your knuckles (peaks), the low points between them (saddles), and the gentle slope on the back of your hand. If you were to draw lines of equal elevation around your fist, they would be close together on the steep sides of your fingers and far apart on the back of your hand. This is exactly how contour lines work on a map.
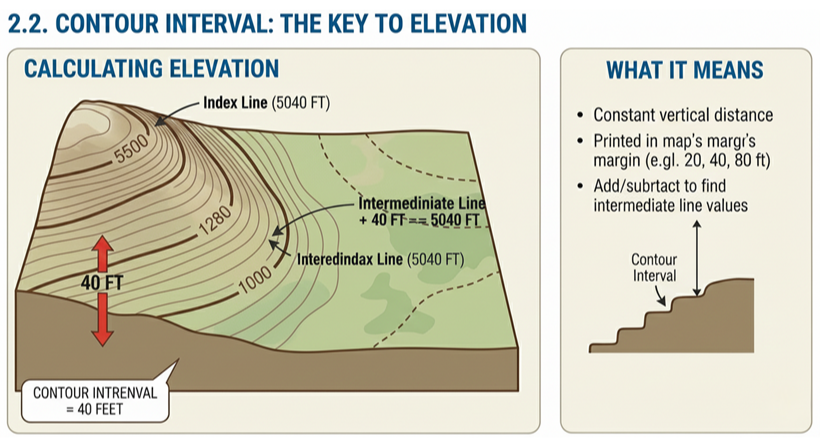
To find the elevation of an intermediate line, simply find the nearest index line, note its elevation, and add or subtract the contour interval for each intermediate line you count. For example, if a nearby index line is marked “5000” and the contour interval is 40 feet, the next intermediate line uphill will be 5040 feet.
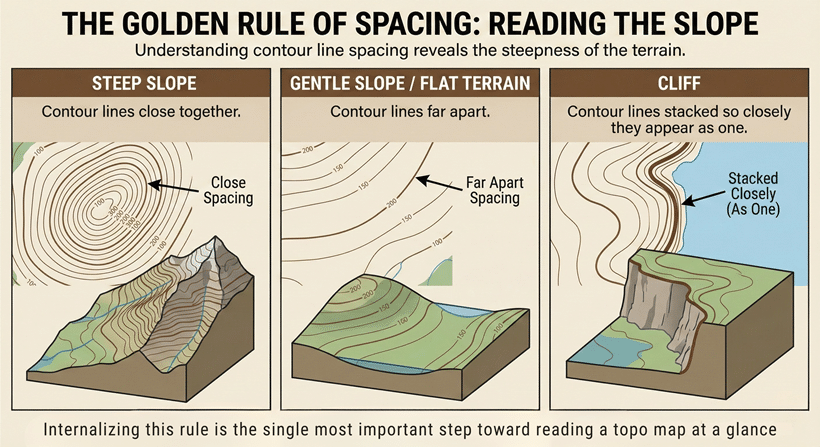
The single most important rule for visualizing the terrain is understanding what the spacing of contour lines tells you about the steepness of a slope.
Internalizing this rule is the single most important step you can take toward reading a topo map at a glance. Now that you understand the theory behind contour lines, let’s look at how their patterns form recognizable shapes on the map.
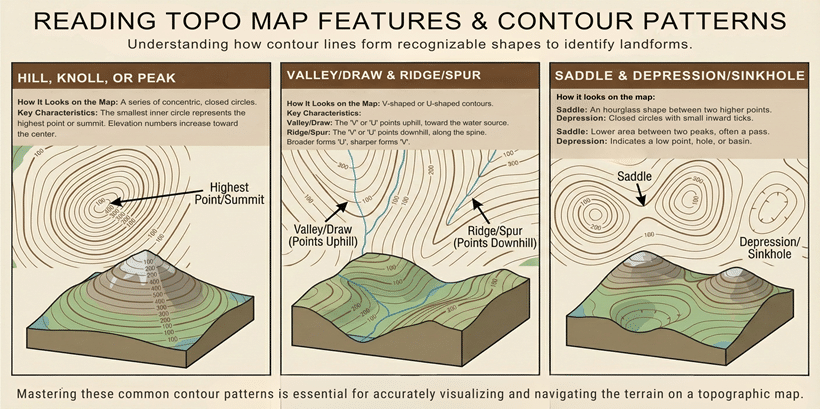
Once you understand contour lines, the next step is learning to read their patterns. These patterns are not random; they form predictable shapes that directly represent real-world landforms. Recognizing these shapes is the key to transforming a flat piece of paper into a three-dimensional mental image of the terrain. Mastering this part of how to read topo maps is what separates beginners from seasoned navigators.
To identify a Hill, Knoll, or Peak, look for a series of concentric, closed circles on the map. The smallest inner circle represents the highest point or summit, and you will notice the elevation numbers increasing as you move toward the center.
A Valley or Draw is characterized by V-shaped or U-shaped contour lines. A helpful rule of thumb is that the “V” or “U” always points uphill, toward the source of the water or higher ground, while water flows out from the open end.
Conversely, a Ridge or Spur appears as U-shaped or V-shaped contours that point downhill. Broad ridges often form a ‘U’ shape, while sharper spurs form a ‘V,’ but in both cases, the point of the shape indicates the direction of the slope going down along the spine of the landform.
A Saddle is distinctive because it looks like an hourglass shape situated between two higher points, such as two peaks. It represents the lower ground between them and is often used as a natural pass or travel corridor.
Finally, a Depression or Sinkhole is marked by contour lines forming a closed circle with small inward ticks. These tick marks indicate a dip, hole, or basin where the elevation is lower than the surrounding terrain.
With the ability to recognize these features, you can begin to build a complete mental picture of the terrain before you even set foot on the trail.
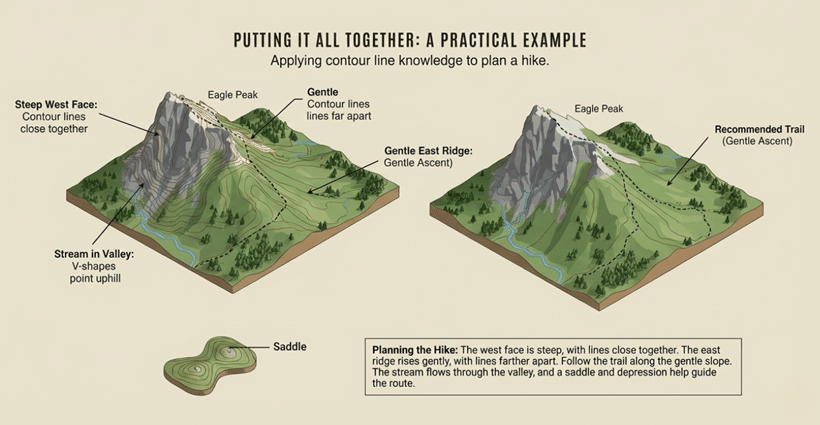
Now that you know the rules, let’s practice. Imagine you’re planning a hike and looking at a section of a map that shows Eagle Peak and the valley below it.
You can tell the west face of Eagle Peak is very steep because the brown contour lines are packed tightly together, indicating a rapid ascent. On the east side, the lines are spread further apart, showing a gentler slope that forms a long ridge. A stream, marked by a blue line, flows through the valley at the base of the peak. You can confirm the water flows downhill because the “V” shapes in the contour lines that cross the stream point uphill, away from the stream’s open end. This is a fundamental part of learning how to read a topo map correctly. As a savvy navigator, you immediately see the smarter route. You’ll plan your ascent along the gentle eastern ridge, using the dashed black trail. This avoids the dangerous western face and offers a more efficient path to the summit.
From the summit of Eagle Peak, you spot a low point, an hourglass shape between it and the next peak over. That’s a saddle, a perfect spot to drop down and cross to the next drainage, or a potentially sheltered spot to camp for the night.
Here are answers to some of the most common questions beginners have when learning to navigate with a topographic map.
What’s the main difference between a topographic map and a regular road map?
A road map shows you how to get from one place to another using roads, but a topo map shows the shape of the land itself, the hills, valleys, and slopes using contour lines.
How can I quickly tell if I’m going uphill or downhill?
Find the nearest index lines (the thick ones with numbers). If the numbers are increasing in the direction you are going, you are heading uphill. If they are decreasing, you are heading downhill.
Why should I bother with a paper map when I have GPS on my phone?
Paper maps don’t run out of batteries, lose signal, or break when dropped. They are an essential and reliable backup for any outdoor trip and provide a much broader view of the surrounding landscape than a small screen.
What does “datum” mean in the map legend?
The datum (e.g., NAD27, WGS84) is a mathematical model of the Earth used to create the map. If you are using a GPS device with your paper map, ensuring the datum on both the map and the device match is critical for accurate coordinate plotting.
By learning to read a map’s legend, interpret contour lines, and identify key terrain features, you have unlocked a powerful skill. Reading a topographic map is more than just navigation; it’s about understanding the world around you in a deeper, more intimate way. It builds confidence, enhances safety, and opens the door to countless new adventures.
Don’t just read this guide, use it. Get a topographic map of a local park you know well. Take it with you on your next walk. Find a hill and match it to the circles on your map. Find a creek and trace the ‘V’s pointing uphill. The moment the lines on the paper click into place with the landscape in front of you is a game-changer. Get out there and practice; you’ll be reading the land like a pro in no time.
Please also read this blog: A Beginner’s Guide to Understanding and Reading Plat Maps
To the untrained eye, a plat map is a confusing web of lines and numbers.…